 Christmas Mega Sale – Enjoy Up to 50% OFF on Every Plan!
Creating a good user experience for website visitors is not a piece of cake. There is no single proven formula for a good UX.
However, you must pay close attention at regular intervals to specific metrics at regular intervals. It can provide you and your team with a number of actionable insights. These insights can help you identify issues that you need to work on for improving site speed.
There are 5 key metrics that you must take a look at to ensure that your website is performing optimally. In this article, we’ll try to understand these 5 metrics and take a look at why they are so important in determining your website’s UX quality.
Let’s get into it!
1. Time to First Byte

TTFB or Time to First Byte is the time taken by a mobile or web browser to fetch the first byte of information or response from the server once a user requests a specific URL. TTFB comprises of three components:
- The time required to forward the HTTP request
- The time the server takes to process the request
- The time the server takes to send back the first byte of information to the user
Your site will fail this audit fails when the browser waits more than 600 ms for the server to respond. Users hate it when pages take a long time to load and most will bounce before it even loads completely. Slow server response times are one possible reason behind long page loads.
When users open a URL, their browser makes a network request to fetch that content. Your server receives the request and returns the page content.
The server might have to do a lot of work to return a page with all of the content that users want.
Optimizing the server to do such tasks as quickly as possible is one way to improve the page speed.
2. TCP (Transmission Control Protocol) Connection Time

TCP Connection Time is the time a browser takes to establish a reliable connection with a server. It can sometimes be challenging to identify issues in TCP connections since it depends on multiple factors.
For example, a spike in user traffic due to actual users/bots can result in a spike in connection time. Website visitors from different geographic regions will likely experience longer connection times. In such cases, you should consider using a CDN or a caching server to improve website performance. It’ll also help ensure that users are able to establish faster connections.
3. DNS (Domain Name System) Lookup Time
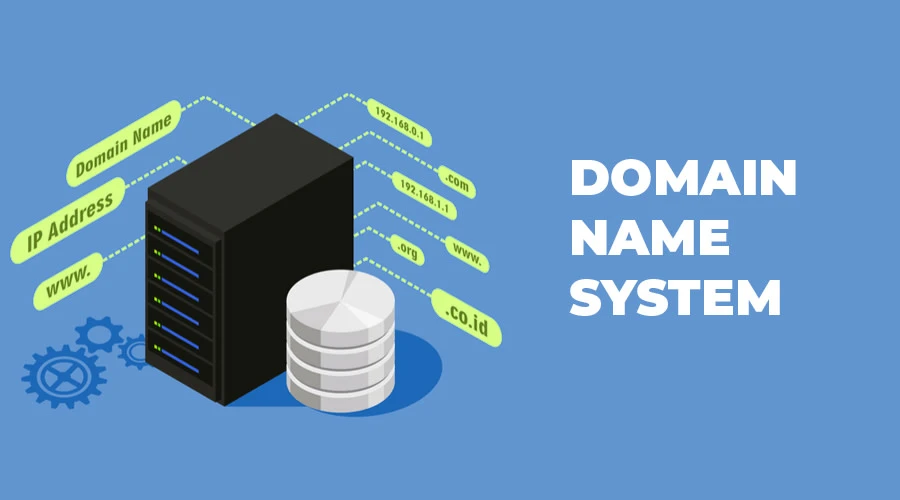
DNS is an abbreviated form of Domain Name System.
A domain name needs to be mapped to an IP address. The DNS Lookup time is defined as the amount of time taken by the DNS provider to translate a domain name into an IP address. With slow-loading web pages, there’s a high probability that the page has multiple DNS lookups.
For example, a social sharing button will lead to additional DNS lookups on a webpage. This results in the page to load slowly. You can solve this by using a reliable DNS provider instead of using free versions.
You must understand the time taken on DNS lookups. It not only provides a more accurate understanding of user experience but can also help motivate decision-makers/webmasters to use DNS lookups wisely.
4. Page Load Time

Page load time is the total time taken by the browser to completely display the content of a particular webpage. A few factors that affect the page load time, among many, include the following:
- Inefficiently written or unoptimized HTML, CSS, & JS scripts
- Unoptimized high-resolution images
- Multiple redirects
- Render-blocking resources
To learn more about page load time and how to improve it, you can check out our following blogs:
Google Page Experience Update 2021 and Core Web Vitals
4 Best Tools to Analyze your Website Speed
The Growing Importance of Website Page Speed in 2020
WordPress Performance Optimization – Comprehensive Guide
Shopify Performance Optimization: Best Practices and Tips
5. Page Response Time
Page response time is the time taken to completely receive the first response from the target server. If the page response time is low, there are high chances of users bouncing from the site. Google says that the response time should be less than 200ms.
There are many potential factors that may slow down the response of your server. These factors include slow application logic, slow routing, slow database queries, frameworks, libraries, resource CPU starvation, or memory starvation.
You should take all these factors into consideration to improve your server’s response time. To find out why the server response time is high, the first step is to measure. Subsequently, with data in hand, refer to the relevant guides to find out how to address the problem. Once you’ve resolved the issues, continue measuring your server response times regularly. While doing so, address any future performance bottlenecks as and when they occur.
Final Words
You must keep an eye on the metrics discussed above. This will enable you to evaluate your websites for speed or performance issues at regular intervals. You can use tools like Google PageSpeed Insights and GTMetrix to analyze to performance of your site. These tools can also help you identify performance bottlenecks on your site so that you can address them.
Make sure that your website loads quickly to ensure that it provides a good user experience to all visitors.
Got any questions? Let us know in the comments below or write to us and we’ll get back to shortly!