 Christmas Mega Sale – Enjoy Up to 50% OFF on Every Plan!

Some time ago, Google announced a new ranking factor for 2024. And it caused quite a stir.
“Page Experience” is the new ranking factor and it changes a few things.
User experience has always been integral to building a quality website but now it’ll play a bigger role than ever. You must focus on the kind of experience that your website provides your visitors.
Page Experience, the new ranking signal, combines Core Web Vitals with existing user experience signals to improve the evaluation of the overall experience provided by a page.
Although it is not bound to launch before late 2024, that doesn’t stop you from being proactive and adapting for the change when there is still time at hand.
And, Google being Google, they have provided an early look into the work being done so far.
Don’t know what Core Web Vitals are?
Don’t worry! That’s why we’ve written this early guide to Core Web Vitals and Google’s latest ranking factor.
Google Page Experience Update
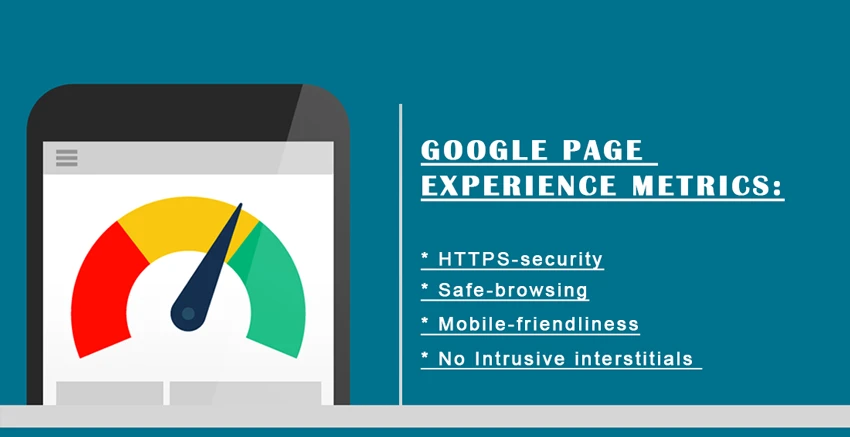
The Google page experience signal consists of the Core Web Vitals, as well as the existing page experience metrics. The existing Google page experience metrics include the following:
- HTTPS-security
- Safe-browsing
- Mobile-friendliness
- No Intrusive interstitials
These metrics aim to understand how a user will perceive the experience of a specific web page. It considers factors such as whether the page loads quickly, if it’s mobile-friendly, runs on HTTPS, if there are intrusive ads present, and if content moves around as the page loads.
Web Vitals is an initiative by Google to provide unified guidance for quality signals that are essential to delivering a great user experience on the web.
This initiative aims to simplify the landscape and help sites focus on the metrics that matter most, the Core Web Vitals. We’ll discuss more on Core Web Vitals in the following sections.
You can view Google’s detailed documentation for page experience here.
Core Web Vitals
Introduced in May 2020, Core Web Vitals are a set of metrics related to speed, responsiveness, and visual stability of a website.
Core Web Vitals are the subset of Web Vitals that apply to all web pages and should be measured by all site owners.
All Core Web Vitals represents a distinct facet of the user experience. Each is measurable in the field, on real users actually loading and interacting with the page. Each reflects the real-world experience of a critical user-centric outcome.
Google has defined the following as Core Web Vitals:
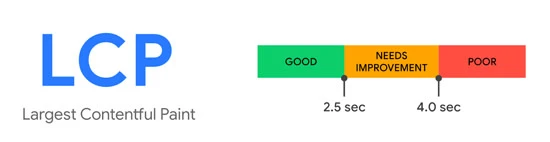
- Largest Contentful Paint (LCP): LCP measures the loading performance of a website, or how long it takes for a page’s main content to load. LCP should occur within 2.5 seconds of when the page first starts loading, to provide a good user experience.
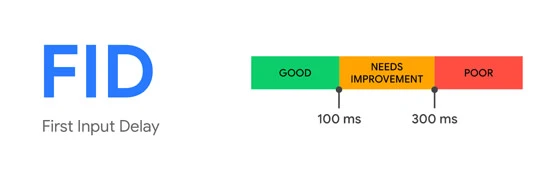
- First Input Delay (FID): FID measure interactivity or the time your website takes to become interactive. Ideally, you should maintain an FID of less than 100 milliseconds.
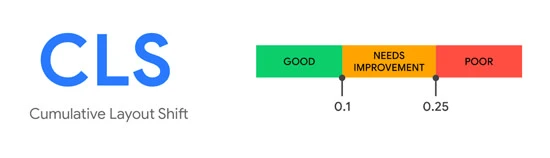
- Cumulative Layout Shift (CLS): CLS measures the visual stability of a page or the amount of unexpected layout shift of visual content on a page. You should aim for a CLS score of less than 0.1
These Core Web Vitals are not set in stone. Chromium blog states that they expect to update Core Web Vitals on an annual basis. Although Google Developers blog states that, “The Core Web Vitals are relevant to all web pages and featured across relevant Google tools. Changes to these metrics will have a wide-reaching impact; as such, developers should expect the definitions and thresholds of the Core Web Vitals to be stable, and updates to have prior notice and a predictable, annual cadence.”
Let us now take a look at each of the Core Web Vitals metrics in detail.
LCP or Largest Contentful Paint
Largest Contentful Paint (LCP) measures the time at which the largest content element appears on the screen. Please note that it does not measure the time taken by your page to fully load. It simply looks at and measures when the most important part loads.
In the case of a simple web page with only a piece of text and a large image/video, that large image/video will be considered the LCP. Since this is the largest piece of content to load on a browser, it’s bound to make an impression. By getting that largest piece of content to load quicker, your site can appear much faster. So, sometimes, it might just be as simple as optimizing that image/video itself.
Now that you know what LCP is, you can start optimizing it. Your aim is to get LCP loaded in 2.5 seconds or less. Anything below 4 seconds needs less and anything above 4 seconds is considered poor by Google.
The LCP is also dynamic, since the first thing that loads might not immediately be that large image. The LCP shifts to that large image when that appears on the screen.
Let’s take a look at an image from Google that explains how that works:
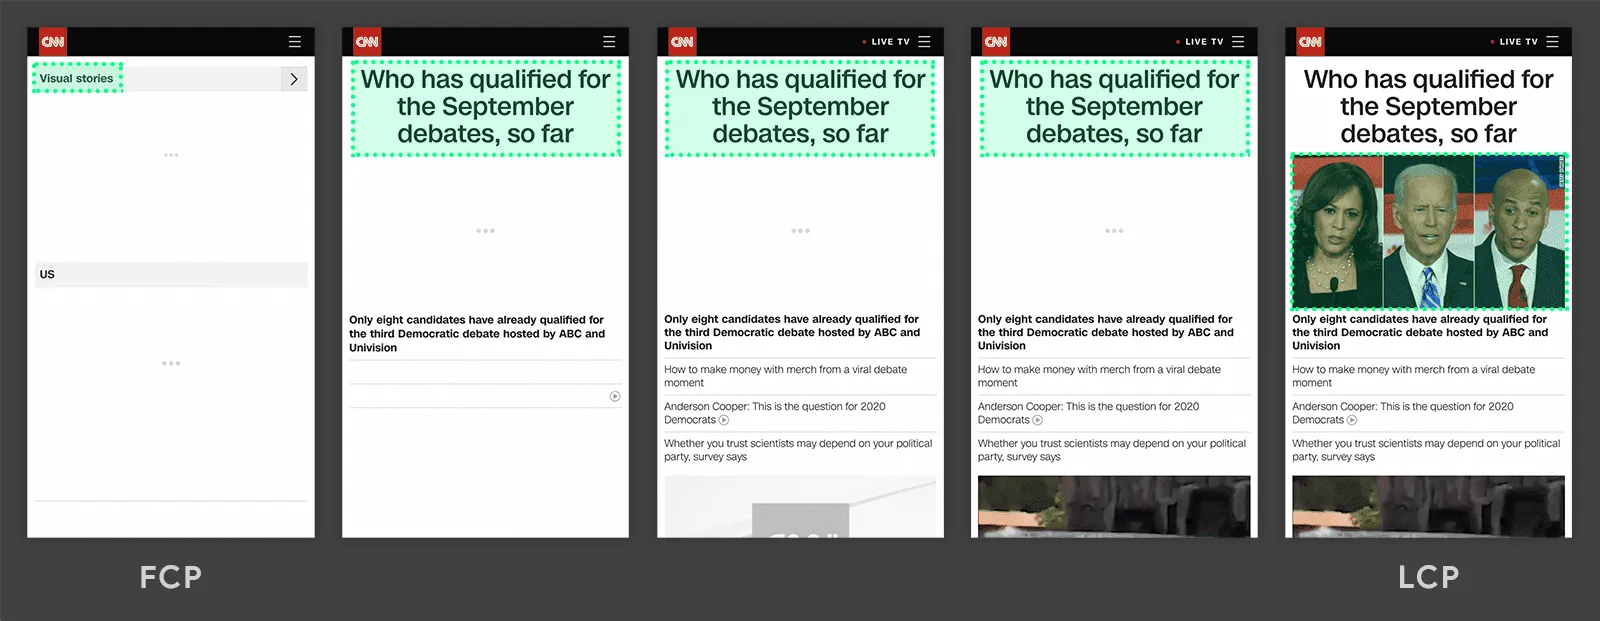
In the first image on the left, you’ll see the top menu bar with the logo and ‘Visual Stories’ section load up. This is the First Contentful Paint. Then, in the next 3 images, the headline appears as a candidate for LCP. But, in the last image, the image takes place of the headline as the LCP candidate.
How to improve LCP?
According to Google, LCP is primarily affected by four factors:
- Slow server response times
- Render-blocking JavaScript and CSS
- Resource load times
- Client-side rendering
Optimizing these factors will improve your LCP score! You can check out the Google Developers blog to know more about optimizing LCP.
FID or First Input Delay
First Input Delay measures the time taken by the browser to respond to the first interaction by the visitor. The quicker the browser’s reaction, the more responsive the page will appear. You should work on the responsiveness of your pages if you’re looking to offer a positive user experience.
Delay happens when the browser is kept busy with other work in the background. So, it has loaded the page but nothing happens when you tap that button. That’s a bad experience and it leads to frustration.
Remember, even if there’s just a small delay it might make your site feel sluggish and unresponsive.
FID measures all interactions that take place while the page is being loaded. These are input actions like taps, clicks, and keypresses. But it does not include interactions like zooming and scrolling.
Google’s new metrics call for an FID of less than 100ms to appear responsive.
You must remember:
You cannot measure the FID if there is no user interaction. This implies Google can’t simply predict the FID based on the data they have from the lab. Google needs data from real users, also called field data. This also means that this data is less controllable than lab data. This is because it collects data from users will all kinds of devices and who use them in different ways & environments.
How to reduce FID?
According to Google, you can reduce FID by performing the following optimizations:
- Reduce the impact of third-party code
- Reduce JavaScript execution time
- Minimize main thread work
- Keep request counts low and transfer sizes small
You can check out the Google Developers blog to know more about optimizing FID
CLS or Cumulative Layout Shift
CLS or Cumulative Layout Shift tries to determine how stably all the elements load onto your screen. It measures how often elements jump around while loading and by how much.
CLS compares frames to determine the movement of elements. It takes all the points at which unexpected layout shifts happen and calculates the severity of those movements. If a user clicks the menu button and a fold-out menu appears, that doesn’t count as a layout shift since it is expected behavior.
Sometimes a button loads on the screen, inviting users to click it. However, in the background, there’s still a large content area being loaded. So, when the content finally loads completely, the button moves down a bit as you were about to hit it. This affects your CLS score.
Ads are also a common culprit of a poor CLS score since ads cause a lot of layout shifts.
Let us take an example of multiple unstable elements, as shown by Google:
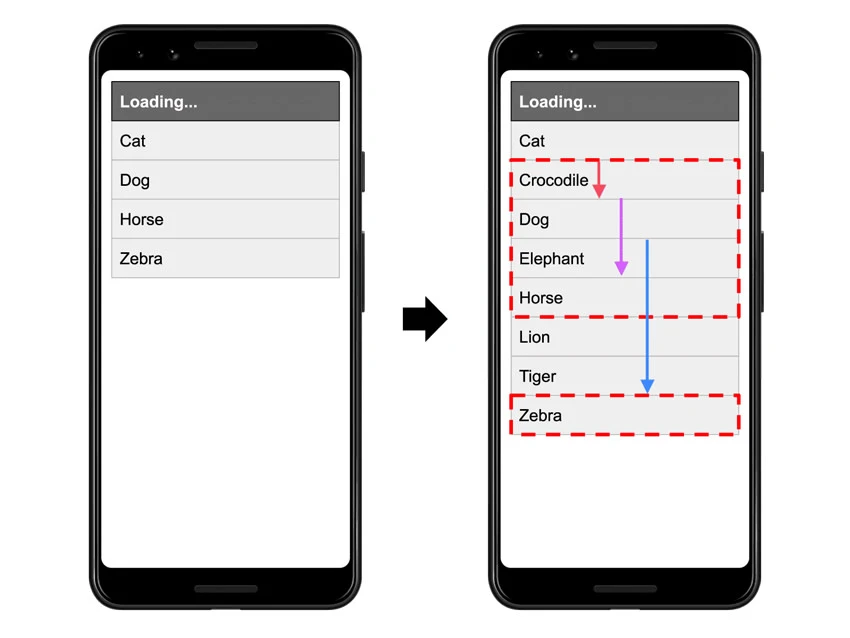
In the first frame above there are four results of an API request for animals, sorted in alphabetical order. In the second frame, more results are added to the sorted list creating an unexpected layout shift.
Many complex sites have so many functionalities and elements that these are heavy to load and content gets loaded whenever it’s ready. This can often also result in content or CTAs jumping around on the screen, making room for slower loading content.
How to improve CLS?
According to Google Developers blog, you can avoid all unexpected layout shift by adhering to the following principles:
- Always include size attributes on your images and video elements, or otherwise reserve the required space with something like CSS aspect ratio boxes. This ensures that the browser can allocate the correct amount of space in the document while the image is loading.
- Never insert content above existing content, except in response to user interaction. This ensures any layout shifts that occur are expected.
- Prefer transform animations to animations of properties that trigger layout changes. Animate transitions in a way that provides context and continuity from state to state.
Official tools to measure Core Web Vitals
There are loads of tools to help you monitor Web Vitals and improve the performance of your site. Here are the most important ones:
- PageSpeed Insights: Google PageSpeed Insights is a full-service measuring tool with both the field as well as lab data. It also gives you advice on what to improve.
- Lighthouse: Google built Lighthouse as a tool to audit PWAs, but now it’s a great tool to monitor performance. It has several audits that PageSpeed Insights doesn’t have and it even has some SEO checks.
To check Core Web Vitals using Lighthouse, go to a page you want to analyze, right-click, and select “Inspect”. After that, click on the “Lighthouse” button as shown below.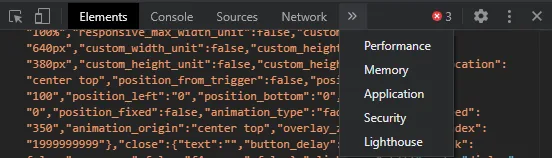
Now, select the categories that you want to test for and tap the “Generate Report” button.

- Search Console Core Web Vitals report: You can now get insights from your site straight from Search Console. This is great to get an understanding of how your site is performing.
Other Web Vitals
While the Core Web Vitals are the critical metrics to understand and deliver great user experience, there are other important metrics as well.
These other Web Vitals often serve as supplemental metrics for the Core Web Vitals. They help capture a larger part of the experience and assist in diagnosing a specific issue.
For example, the metrics Time to First Byte (TTFB) and First Contentful Paint (FCP) are both integral aspects of the loading experience. Both are useful in diagnosing issues with LCP.
TTFB helps determine whether slow server response times are slowing your website. FCP helps determine if there are any render-blocking resources on your page.
Metrics like Total Blocking Time (TBT) and Time to Interactive (TTI) are lab metrics that are important in finding and diagnosing potential interactivity issues that will impact FID.
But, these metrics are not part of the Core Web Vitals because they are not field-measurable, nor do they reflect a user-centric outcome.
Final Words
Soon, Google will incorporate a new ranking factor in its algorithm: page experience. Google developed a new set of metrics which are called the Web Vitals to measure page experience. You can find three core metrics within these Web Vitals: Largest Contentful Paint, First Input Delay, and Cumulative Layout Shift. These represent performance, responsiveness, and visual stability, the three pillars of Google’s page experience update.
Did we miss out on something important? Let us know in the comments below.
Want to know more about optimizing Core Web Vitals? Get in touch with us today, and we’ll help you out.
I love the efforts you have put into this great article.