 Christmas Mega Sale – Enjoy Up to 50% OFF on Every Plan!

In the digital age, website optimization is paramount for providing a superior user experience and achieving high search engine rankings. One often overlooked but powerful tool in this process is the utilization of JavaScript console logs. These logs are not just for debugging but can significantly contribute to optimizing your website’s performance.
Understanding JavaScript Console Logs
JavaScript console logs are debugging tools built into browsers that allow developers to print information to the console, making it easier to debug issues or understand what’s happening in the code at runtime.
These logs can display various types of information, from simple text messages to complex object structures, and they play a crucial role in both development and optimization processes.
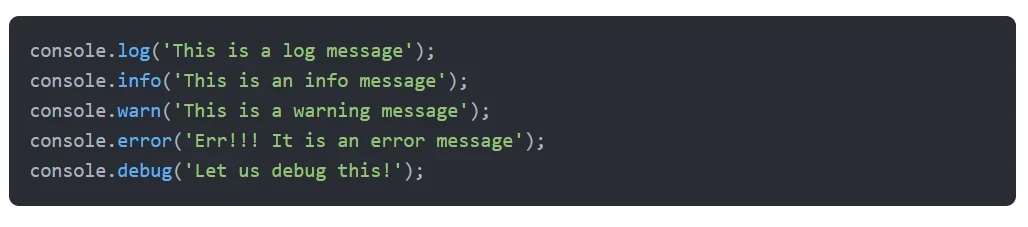
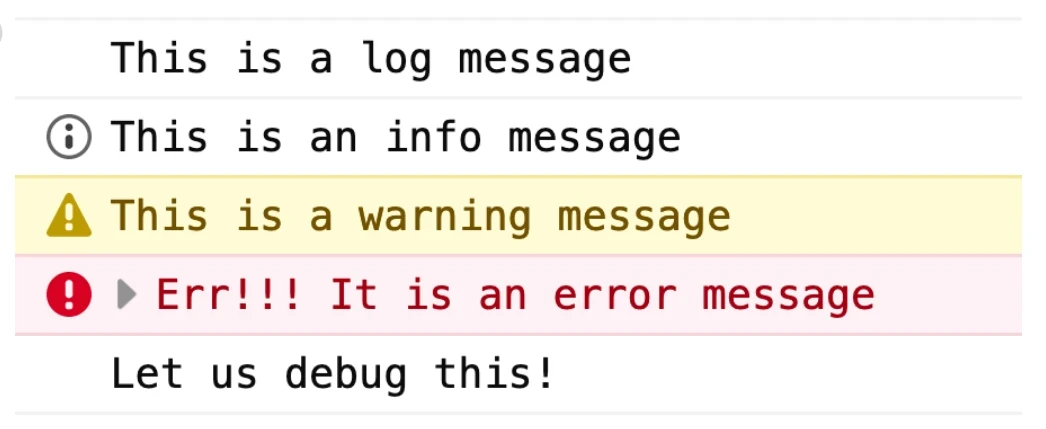
The JavaScript console provides several methods for logging, including console.log(), console.warn(), console.error(), and console.info(), each serving a different purpose.
Console.error() is particularly useful for highlighting errors with a distinct visual cue (red text or background) in the console.
These logging methods offer visual cues that can help quickly identify the severity and nature of the messages logged, thus aiding in the debugging process.
Benefits of Using Console Logs for Website Optimization
Console logs can greatly enhance website performance by identifying bottlenecks and issues that are not immediately apparent.
Using console.time() and console.timeEnd() can help measure the execution time of specific functions or code blocks, providing insights into potential performance issues.
By identifying slow-running functions or processes, developers can make targeted optimizations to improve site speed and responsiveness.
Console logs can be used to test and optimize code execution and rendering processes, ensuring that critical resources are loaded efficiently and in the right order.
Examples of Performance Issues Identified with Console Logs
One common performance issue that console logs can help identify is inefficient code execution, where certain functions or scripts take longer than expected to run. This can be pinpointed using the console.time() method to time code execution, revealing functions that may need optimization for speed.
Another example is the detection of unhandled errors and warnings that could be impacting the user experience or causing functional issues on the site.
By logging these errors as they occur in the development phase, developers can address them before they affect the end-users, using methods like console.error() and console.warn() to highlight and address these issues.
JavaScript console logs are invaluable tools for website optimization, providing insights that can lead to significant improvements in site performance.
By understanding and utilizing the various logging techniques and methods available, developers can ensure their sites are not only functional but also optimized for speed and efficiency.
Best Logging Techniques for Peak Performance
Maximizing your website’s performance involves not just building and deploying efficient code but also establishing a robust logging strategy. Here are some best practices for using console logs effectively:
- Selective Logging: Log only what’s necessary. Over-logging can clutter your console and make debugging more challenging. Focus on logging critical information that contributes to understanding and diagnosing issues.
- Structured Logging: Implement a structured format for your logs. This makes it easier to parse and analyze them, especially when dealing with large volumes of data. Structuring logs in a consistent format (e.g., JSON) can help in automating error tracking and performance monitoring processes.
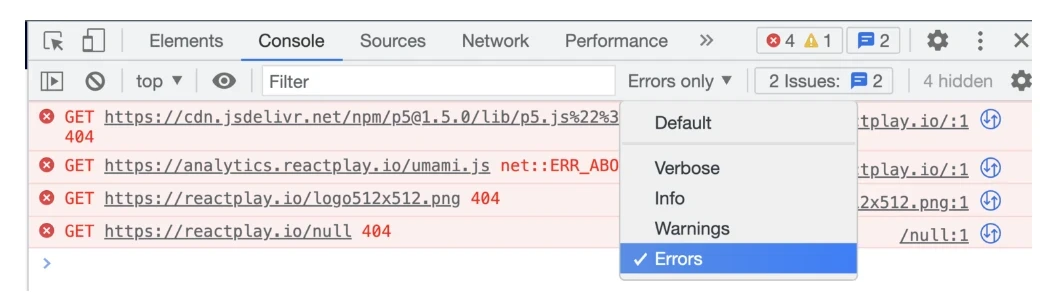
- Using Logging Levels: Differentiate logs by their severity levels—info, warn, error—to quickly identify the nature of the logged messages. This hierarchy not only aids in filtering logs based on severity but also in understanding the impact of the issues logged.
- Cleaning up Logs for Production: While logs are invaluable during development, excessive logging in a production environment can lead to performance degradation and potential exposure of sensitive information. Ensure that logs in production are minimized and contain only what’s necessary for monitoring and diagnostics.
Advanced Techniques and Tools
For deeper insights into website performance, beyond what basic console logging offers, you can explore advanced logging techniques and tools:
- Profiling with console.profile() and console.profileEnd(): These methods allow for in-depth performance analysis by initiating and stopping a JavaScript CPU profile, which provides detailed information about the execution flow and time consumption of your code. However, it’s important to note that these features are non-standard and may not be supported across all browsers.
- Conditional Logging with console.assert(): This method is useful for logging messages based on certain conditions, allowing for more targeted debugging. By using console.assert(), you can ensure that only the relevant issues are logged, based on the specified conditions.
- Remote Debugging: Modern development environments and browsers offer remote debugging capabilities, enabling developers to debug live applications in different environments. This is crucial for diagnosing issues that only appear under specific conditions or on certain devices.
Comparative Analysis: Website Performance Metrics Then and Now
Over the past year, the emphasis on website performance has only increased, with core web vitals becoming a key focus for search engines and developers alike.
Performance metrics such as First Contentful Paint (FCP), Largest Contentful Paint (LCP), and Cumulative Layout Shift (CLS) have taken center stage in optimization efforts.
While specific statistics vary across industries and platforms, the trend is clear: faster, more responsive websites lead to better user experiences and higher search engine rankings.
The evolution of performance metrics from the previous year to the current year reflects a broader shift towards user-centric performance indicators, emphasizing the importance of not just how fast a page loads, but how quickly it becomes useful and interactive for the user.
As tools and techniques for monitoring and improving these metrics have become more sophisticated, websites that prioritize performance optimization are seeing tangible benefits in terms of user engagement, conversion rates, and SEO performance.
Leveraging JavaScript console logs and adopting advanced logging techniques are crucial components of a comprehensive website optimization strategy.
By applying the best practices outlined above and utilizing the right tools, you can ensure that your website not only meets but exceeds the performance expectations of both users and search engines.
Implementing Console Logs in Your Optimization Strategy
Integrating console log analysis into your website optimization strategy can significantly enhance your site’s performance and user experience. Here are some practical tips and recommendations for tools to help you get started:
- Selective and Structured Logging: Use console logs judiciously during the development phase to catch errors early and ensure code quality. Implement structured logging to make it easier to analyze logs, especially when dealing with complex data structures.
- Performance Monitoring: Utilize console.time() and console.timeEnd() to measure the execution time of your code blocks or functions. This can help you identify performance bottlenecks and optimize them for better speed.
- Error Handling: Incorporate try…catch…finally statements to manage errors gracefully. This not only helps in debugging but also ensures that your site remains functional for the user despite encountering errors.
- Use of Advanced Tools: Beyond the built-in console methods, consider using advanced tools for deeper insights. Tools like Google Analytics, Hotjar, and feedback widgets can provide valuable data on user interactions, site speed, and overall performance. These tools can help you gather both quantitative and qualitative insights into how users interact with your site, enabling more targeted optimizations.

- SEO and CRO Analysis: Focus on search engine optimization (SEO) and conversion rate optimization (CRO) as part of your broader website analysis. Tools like Google Search Console, SE Ranking, and Screaming Frog can assist in auditing your site for SEO performance, while Hotjar and Figpii are useful for CRO analysis through user feedback, heatmaps, and A/B testing.
- Usability Testing: Ensure your website is easy to use and navigate by conducting usability testing. This could involve reviewing site functionality, conducting expert reviews, and engaging in user interviews to gain insights into user needs and experiences.
Endnote
Console log analysis, when used effectively, can be a powerful tool in your website optimization toolkit.
By focusing on performance monitoring, error handling, and leveraging advanced tools for deeper insights, you can enhance your site’s user experience and performance.
The goal is to provide a smooth, fast, and engaging experience for your users, which in turn can lead to higher conversions and improved SEO rankings.

