 Christmas Mega Sale – Enjoy Up to 50% OFF on Every Plan!
Google has always been engaged in the process of improving its search engine for users. To this end, they push out updates, add algorithms, and new ranking factors to determine the rankings of websites for each Google search. Website owners should always be on the lookout for such updates. Google plans to include ‘page experience’ as a new ranking factor in 2024. The ‘page experience’ will be determined based on the measurement of the core web vitals of your website.
This new ranking factor can be a game-changer for a lot of businesses and websites just like the “Hummingbird” algorithm update of 2013. In any case, it is best to take action early on and adjust to the changes that are expected.
In this article, we will tell you all that you need to know about this new Google algorithm update, the Core Web Vitals that will determine your performance, and how to optimize your website’s ‘page experience’ by optimizing web vitals.
Google ‘Page Experience’ update driven by Web Vitals
In Google’s own words, here is what page experience means:
“The page experience signal measures aspects of how users perceive the experience of interacting with a web page.
Optimizing for these factors makes the web more delightful for users across all web browsers and surfaces, and helps sites evolve towards user expectations on mobile.
We believe this will contribute to business success on the web as users grow more engaged and can transact with less friction.”
In other words, they are looking for how usable your website is, how user friendly it is, and whether visitors are will find this website convenient, genuine, informative, and pleasing.
The purpose of this update is to make sure that sites that rank at the top aren’t creating experiences that users don’t like.
The easiest way to think about this update is that user-friendly sites will rank higher than sites that aren’t user friendly.
What Google is trying is to adapt its algorithm to more closely align with the mission of showing the sites first that users love the most.
What are Core Web Vitals?
According to Google:
“Core Web Vitals are a set of real-world, user-centered metrics that quantify key aspects of the user experience. They measure dimensions of web usability such as load time, interactivity, and the stability of content as it loads.”
Web Vitals is an initiative by Google to provide unified guidance for quality signals that are essential to delivering a great user experience on the web.
Site owners should not have to be web performance gurus in order to understand the quality of experience they are delivering to their users. The Web Vitals initiative aims to simplify the task and help sites focus on the metrics that matter most, the Core Web Vitals.
Core Web Vitals are the subset of Web Vitals that apply to all web pages, should be measured by all site owners, and will be presented across all Google tools. Each of the Core Web Vitals represents a distinct facet of the user experience, is measurable in the field, and reflects the real-world experience of a critical user-centric outcome.
The Three Pillars of Page Experience
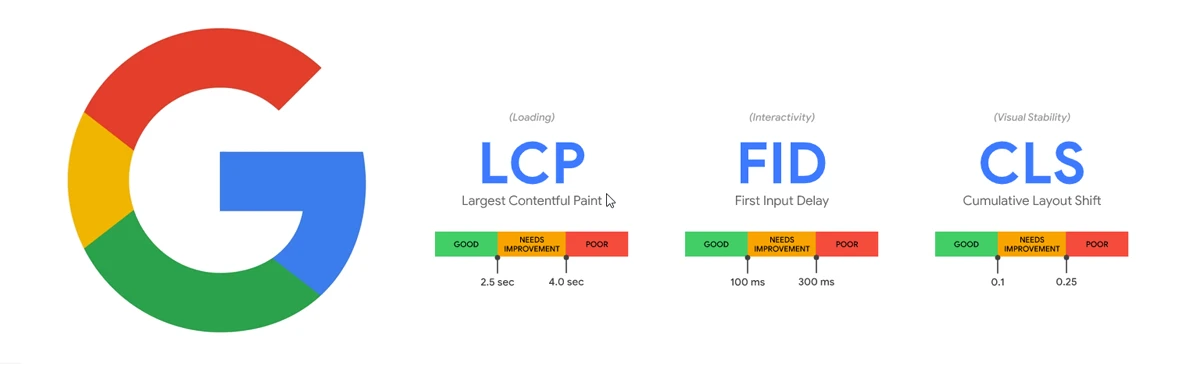
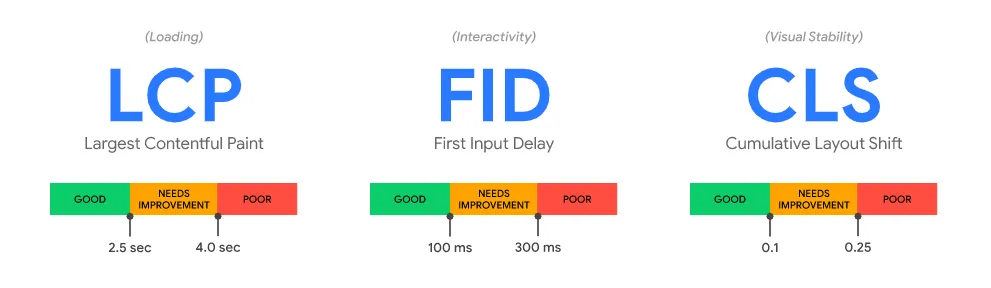
The metrics that constitute Core Web Vitals will evolve over time. The current set of metrics for 2020 focuses on three aspects of the user experience, namely, loading, interactivity, and visual stability. This includes the following metrics (and their respective thresholds):
-
- Largest Contentful Paint (LCP): LCP measures how long it takes for the largest piece of content to appear on the screen. This could be an image or a block of text. A good grade gives users the feeling that the site loads fast. A slow site causes frustration. To provide good user experience, LCP should occur within 2.5 seconds of when the page first starts loading.
-
- First Input Delay (FID): FID measures how long it takes for the site to react to the first interaction by a user. This could be a tap on a button, for instance. A good grade here gives the user a sense that a site is quick to react to input and, therefore, responsive. Slow, again, leads to frustration. Pages should have an FID of less than 100 milliseconds to provide a good user experience.
- Cumulative Layout Shift (CLS): CLS measures the visual stability of your site. In other words, does stuff move around on the screen while it is loading and how often does that happen? Nothing is more frustrating than trying to click a button when a slow-loading ad appears in that spot. To provide good user experience, pages should maintain a CLS of less than 0.1. For each of the above metrics, to ensure you’re hitting the recommended target for most of your users, a good threshold to measure is the 75th percentile of page loads, segmented across mobile and desktop devices.
How to measure Core Web Vitals?
You can measure your website’s Core Web Vitals using a variety of tools like Google Search Console, Lighthouse, Chrome Dev Tools, Chrome UX Report and more. But today, we will look at the simplest way of measuring Core Web Vitals of your website. That is by using Google PageSpeed Insights.
Simply navigate to Google PageSpeed Insights and then enter your webpage URL in the box provided and click analyze.
The PageSpeed Insights tools will take a few second to analyze your webpage and then present a report like this:
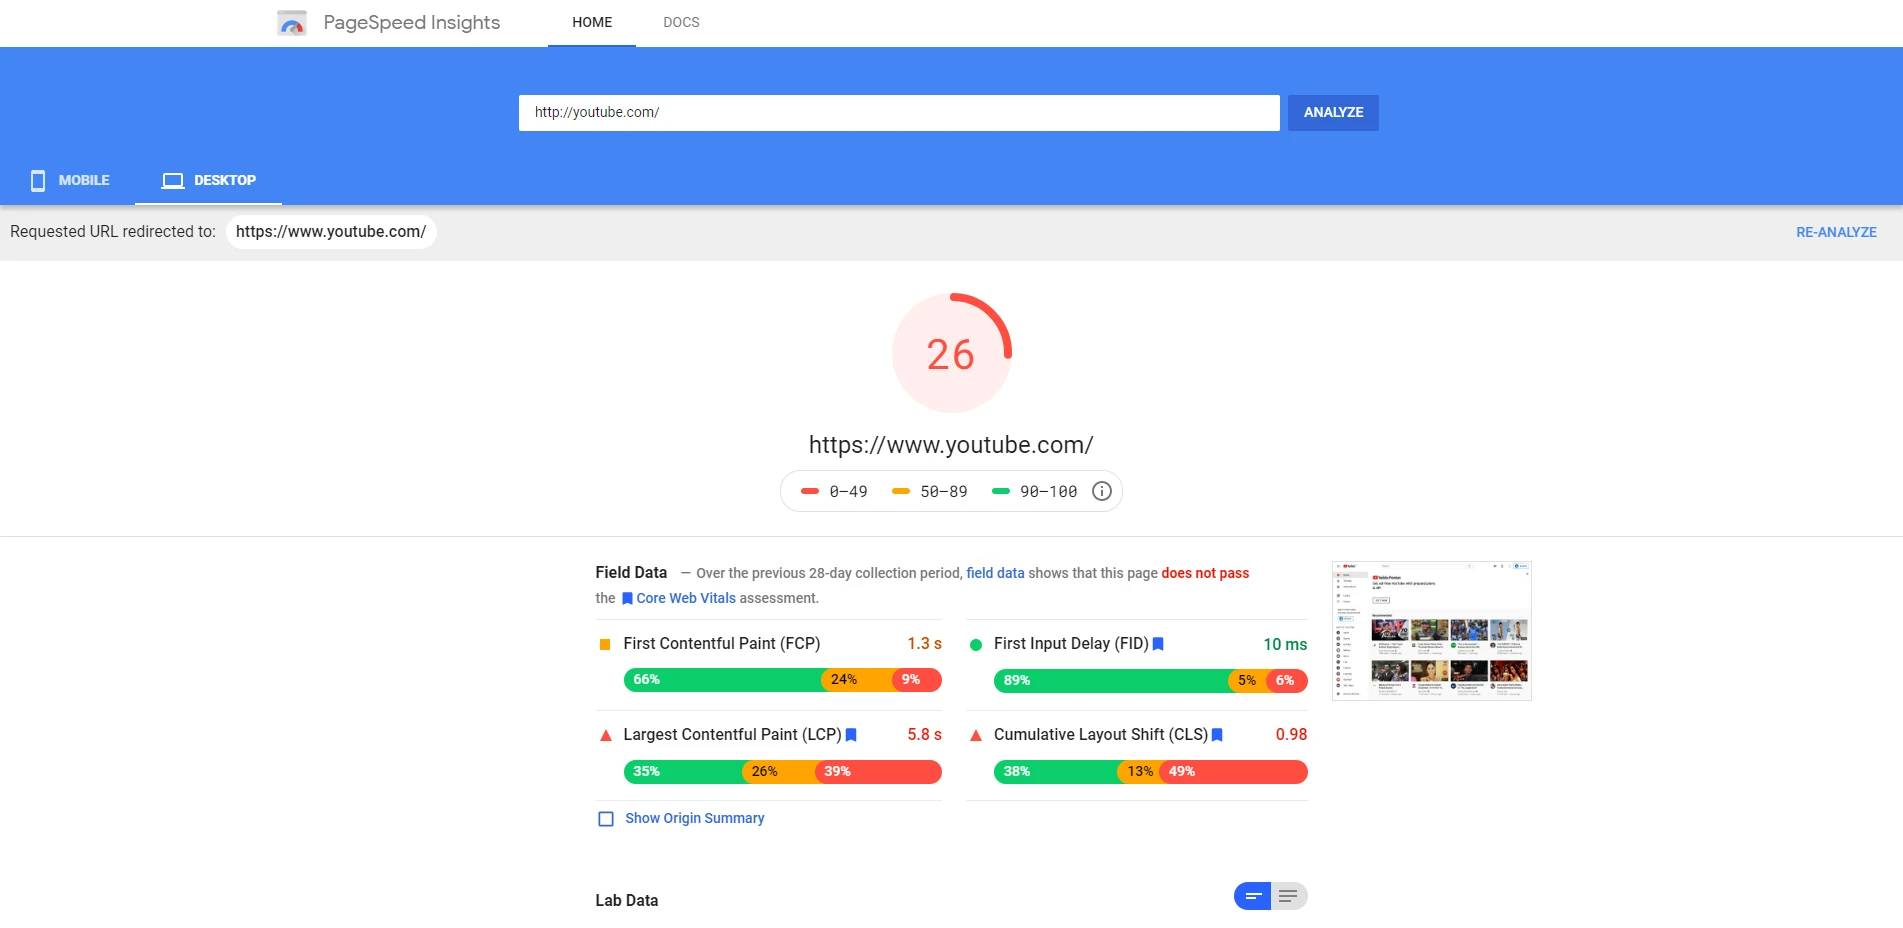
In this report, you can find the Core Web Vitals measurement marked with a blue flag under the heading ‘Field Data’.
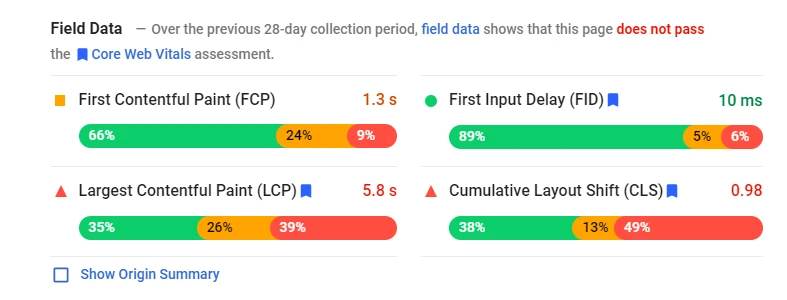
Here, you can find the measurement of all the 4 metrics, that is, FCP, FID, LCP, and CLS.
This is the most convenient and quick way of measuring the performance of your website’s core web vitals.
You can also understand how Lighthouse scores websites in the Google PageSpeed Insights test by checking theLighthouse Scoring Calculator.
Field Data and Lab Data
Web Vitals introduced new ways of determining performance. Some of these metrics can be calculated in a lab setting or simulated in a lab, so to say, while other metrics make sense only if they are tested and collected in the field. In addition, some metrics work well in both settings. Data from metrics collected in a lab setting is called Lab Data whereas data from metrics collected in the field setting is called Field Data.
Google PageSpeed Insights uses both field data and lab data to analyze the performance of your website and suggest improvements.
Optimizing your Website’s Core Web Vitals
Once you’ve measured the Core Web Vitals and identified areas for improvement, the next step is to optimize. In the following sections, we will offer specific recommendations for how to optimize your pages for each of the Core Web Vitals. Let’s get into it!
Largest Contentful Paint – Description and Optimizations
Largest Contentful Paint (LCP) is a Core Web Vitals metric that measures when the largest content element in the viewport becomes visible. It can be used to determine when the main content of the page has finished rendering on the screen.
In simpler words, LCP measures the time from when the page starts loading to when the largest text block or image element is rendered on the screen
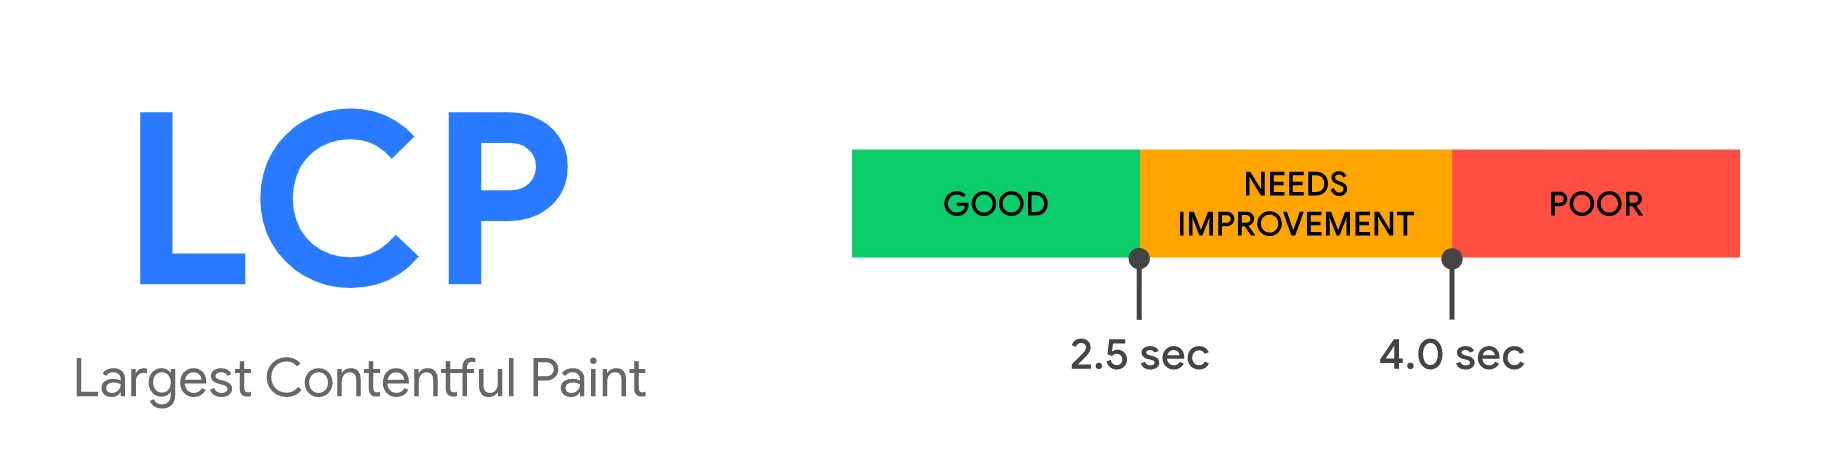
In Google’s opinion, to provide good user experience, LCP should occur within 2.5 seconds of when the page first starts loading. Anything greater than 4 seconds is considered to be a poor performance.
To improve LCP, you’ll have to perform the following optimization on your website:
1. Minimize Render Blocking JavaScript and CSS
When JavaScript or CSS is “blocking” it implies that the browser needs to parse and execute the CSS and JavaScript in order to paint the final state of the page in the viewport.
You might see a warning about render-blocking JavaScript and CSS while checking your website’s performance in Google PageSpeed Insights.
Some specific JS and CSS are sometimes conditional, meaning that they are not required to display above-the-fold content. You can prevent them from becoming render-blocking by using async and defer attributes.
To eliminate render-blocking JavaScript and CSS you need to do the following:
Clear JS from Critical Rendering Path: You can move JavaScript out of the critical rendering path by adding either the ‘async’ or the defer’ attribute to the script HTML elements that call JavaScript resources.
The ‘async’ attribute instructs the browser to start downloading the resource right away without slowing down HTML parsing. Once the resource is available, HTML parsing is paused so the resource can be loaded.
The ‘defer’ attribute tells the browser to hold off downloading the resource until HTML parsing is complete. Once the browser has finished with the HTML, then it will download and render all the deferred scripts in the order in which they appear in the document.
Optimize Delivery of CSS Resources: Optimizing the delivery of CSS essentially means you need to figure out how to make it non-render blocking.
You should identify the styles that are required to render above-the-fold content and deliver those styles inline with the HTML. You should use CSS conditionally on devices only when needed. Make sure that you minify CSS and defer non-critical CSS. Also, load the remaining CSS asynchronously.
2. Improve Server Response Time
The longer it takes a browser to receive content from the server, the longer it takes to render anything on the screen. A faster server response time directly improves every single page-load metric, including LCP.
Before anything else, improve how and where your server handles your content. Use Time to First Byte (TTFB) to measure your server response times. You can improve your TTFB in a number of different ways:
Optimize your Server: Analyzing and improving the efficiency of your server-side code will directly improve the time it takes for the browser to receive the data. Take help of your hosting provider to optimize your server for the best performance.
Use a CDN: CDN stands for Content Delivery Network. These are a network of servers located around the globe. Their main purpose is to host and deliver copies of your WordPress web site’s static content such as images, CSS, JS, and video streams quickly and efficiently.
When you use a CDN, every time a user visits your website they are served the static files from whichever server is closest to them. Your web hosting server will also be faster since the CDN is doing a lot of its work.
Enable Caching: Caching saves an HTML copy of the website for a specified time. For a website, we could set the cache to expire once a day. This means that once a day the website will load normally; it will detect a request, get the server to process the code, and show the result as HTML. It will also save the resulting HTML in memory.
The next time when someone loads the website, the cache would load the HTML from memory instead of getting the server to process it.
It reduces the amount of work required to generate a page view. As a result, your web pages load much faster, directly from the cache.
Establish third-party Connection early: Server requests to third-party origins can also impact LCP, especially if they’re needed to display critical content on the page. Use rel=”preconnect” to inform the browser that your page intends to establish a connection as soon as possible.
<link rel=”preconnect” href=”https://example.com”>
You can also use dns-prefetch to resolve DNS lookups faster.
<link rel=”dns-prefetch” href=”https://example.com”>
Although both hints work differently, consider using dns-prefetch as a fallback for browsers that do not support preconnect.
<head>
…
<link rel=”preconnect” href=”https://example.com”>
<link rel=”dns-prefetch” href=”https://example.com”>
<head>
3. Improve Resource Load Times
Although an increase in CSS or JavaScript blocking time will directly result in worse performance, the time it takes to load many other types of resources can also affect paint times. The types of elements that affect LCP are:
- <img> elements
- <image> elements inside an <svg> element
- <video> elements (if specified, the poster image is used to measure LCP)
- An element with a background image loaded via the url() function (as opposed to a CSS gradient)
- Block-level elements containing text nodes or other inline-level text elements
The time it takes to load these elements if rendered above-the-fold will have a direct effect on LCP. There are a few ways to ensure these files are loaded as fast as possible:
Optimize and compress images: For many sites, images are the largest element in view when the page has finished loading. Hero images, large carousels, or banner images are all common examples of this.
Improving how long it takes to load and render these types of images will directly speed up LCP. To do this:
- Consider not using an image in the first place. If it’s not relevant to the content, remove it.
- Compress images (with an online or offline tool)
- Convert images into newer formats (JPEG 2000, JPEG XR, or WebP)
- Use responsive images
- Consider delivering images using a CDN
Preload important resources: At times, important resources that are declared or used in a certain CSS or JavaScript file may be fetched later than you would like, such as a font placed deep in one of the many CSS files of an application.
If you know that a particular resource should be prioritized, use to fetch it sooner. Many types of resources can be preloaded, but you should first focus on preloading critical assets, such as fonts, above-the-fold images or videos, and critical-path CSS or JavaScript.
<link rel=”preload” as=”script” href=”script.js”>
<link rel=”preload” as=”style” href=”style.css”>
<link rel=”preload” as=”image” href=”img.png”>
<link rel=”preload” as=”video” href=”vid.webm” type=”video/webm”>
<link rel=”preload” href=”font.woff2″ as=”font” type=”font/woff2″ crossorigin>
Compress text files: This is another potentially huge speed gain for your website. Compression reduces the size of various assets including text files before sending them to your browser for interpretation.
The reason this is so helpful is that HTML, JavaScript, and CSS use a lot of repeated content. The more patterns you have in your content the better it can be compressed.
This is something that needs to be set up on your server through the FTP.
You can check out this GTmetrix article for a quick tutorial on how to enable compression on your WordPress website.
Adaptive Serving: If you have large assets that are critical for initial rendering, you can use different variations of the same resource depending on the user’s connection or device. For example, you can display an image instead of a video for any connection speeds lower than 4G:
if (navigator.connection && navigator.connection.effectiveType) {
 if (navigator.connection.effectiveType === '4g') {
   // Load video
 } else {
   // Load image
 }
}
A list of useful properties that you can use:
- navigator.connection.effectiveType: Effective connection type
- navigator.connection.saveData: Data-saver enabled/disabled
- navigator.hardwareConcurrency: CPU core count
- navigator.deviceMemory: Device Memory
First Input Delay – Description and Optimizations
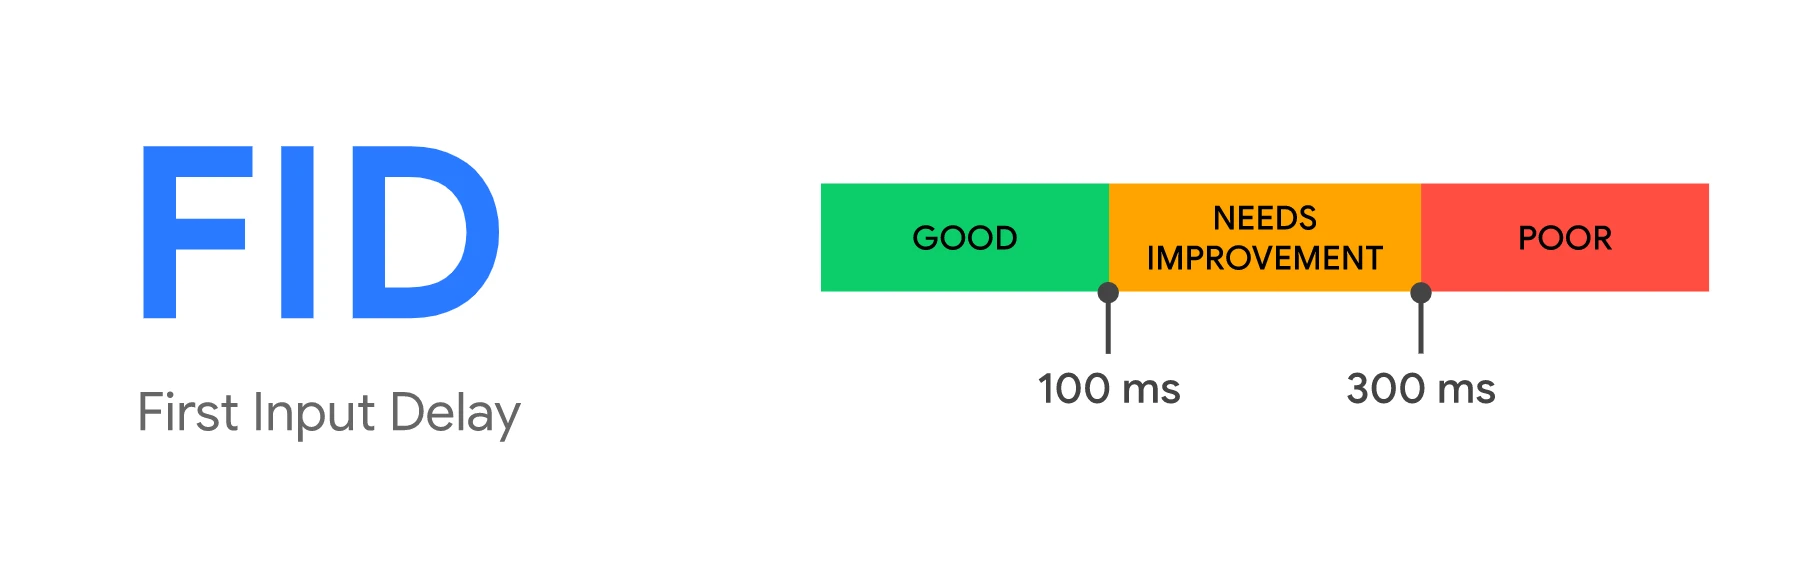
First Input Delay (FID) is a Core Web Vitals metric that captures a user’s first impression of a site’s interactivity and responsiveness. It measures the time from when a user first interacts with a page to the time when the browser is actually able to respond to that interaction. FID is a Field metric and cannot be simulated in a lab environment. A real user interaction is required in order to measure the response delay.
The main cause of a poor FID is heavy JavaScript execution. Optimizing how JavaScript parses, compiles, and executes on your web page will directly reduce FID.
The browser cannot respond to most user input while it’s executing JavaScript on the main thread. In other words, the browser can’t respond to user interactions while the main thread is busy. To improve this, you can perform the following optimizations:
1. Break Up Long Tasks
If you’ve already attempted to reduce the amount of JavaScript that loads on a single page, it can be useful to break down long-running code into smaller, asynchronous tasks.
Long Tasks are JavaScript execution periods where users may find your UI unresponsive. Any piece of code that blocks the main thread for 50 ms or more can be characterized as a Long Task. Long Tasks are a sign of potential JavaScript bloat; loading and executing more than a user may need right now.
Splitting up long tasks can reduce input delay on your site.
FID should improve noticeably as you adopt best practices like code-splitting and breaking up your Long Tasks. While TBT is not a field metric, it’s useful for checking progress towards ultimately improving both Time To Interactive (TTI) and FID.
2. Optimize your Page for Interaction readiness
There are a number of common causes for poor FID and TBT scores in web apps that rely heavily on JavaScript:
First-party script execution can delay interaction readiness:
-
- JavaScript size bloat, heavy execution times, and inefficient chunking can slow down how soon a page can respond to user input and impact FID, TBT, and TTI. Progressive loading of code and features can help spread this workout and improve interaction readiness.
- Server-side rendered apps may look like they’re getting pixels painted on the screen quickly, but beware of user interactions being blocked by large script executions (e.g. re-hydration to wire up event listeners). This can take several hundred milliseconds, sometimes even seconds, if route-based code splitting is being used. Consider shifting more logic server-side or generating more content statically during build time.
Optimize Data-fetching:
-
- Waiting on a waterfall of cascading fetches (like JavaScript and data fetch for components) can impact interaction latency. Aim to minimize reliance on cascading data fetches.
- Large inline datastores can push out HTML parsing time and impact both paint and interaction metrics. Aim to minimize how much data needs to be post-processed on the client-side.
Improve Third-part Script Execution:
-
- Many sites include third-party tags and analytics which can keep the network busy and make the main thread periodically unresponsive, impacting interaction latency. Explore the on-demand loading of third-party code (for example, maybe don’t load those below-the-fold ads until they’re scrolled closer to the viewport).
- In some cases, third-party scripts can pre-empt first-party ones in terms of priority and bandwidth on the main thread, also delaying how soon a page is interaction-ready. Attempt to prioritize loading what you believe offers the greatest value to users first.
Reduce JavaScript Execution Time: Limiting the amount of JavaScript on your page reduces the amount of time that the browser needs to spend executing JavaScript code. This speeds up how fast the browser can begin to respond to any user interactions.
To reduce the amount of JavaScript executed on your page:
-
- Defer unused JavaScript
- Minimize unused polyfills
Cumulative Layout Shift – Description and Optimization
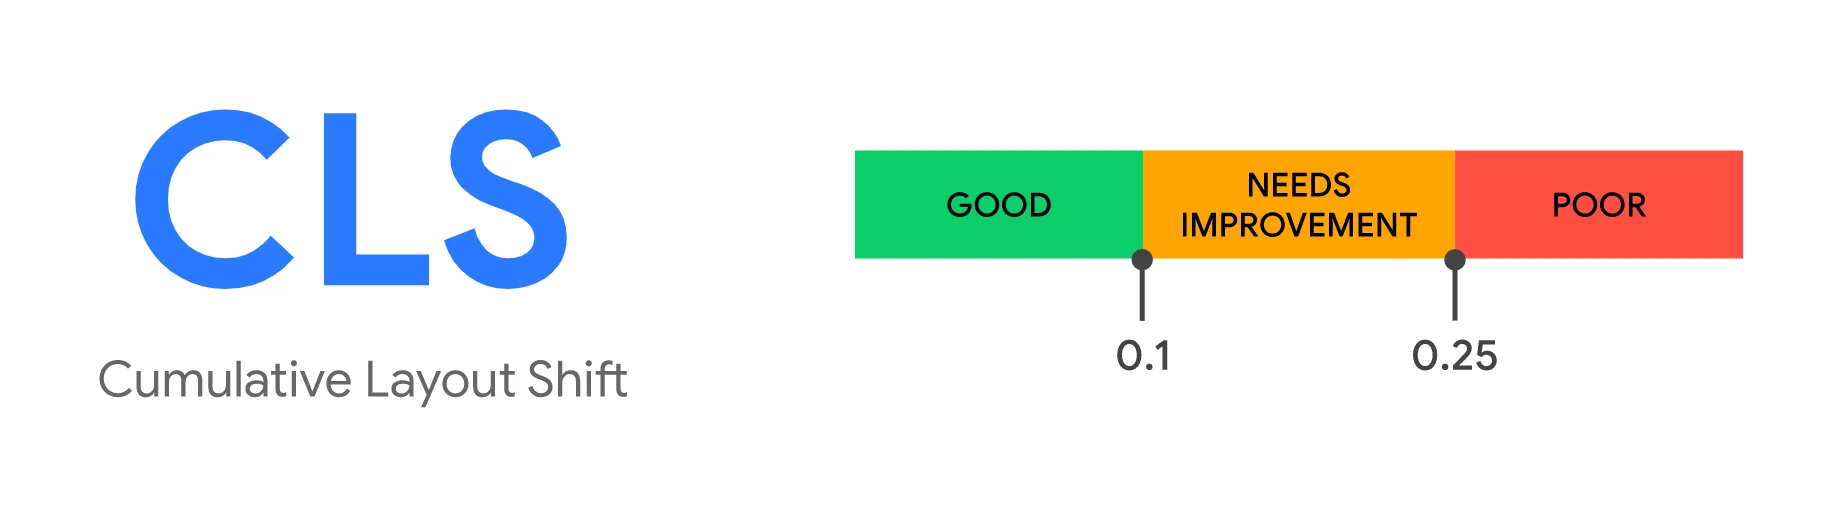
Cumulative Layout Shift (CLS) – a Core Web Vitals metric, measures the instability of content by summing shift scores across layout shifts that don’t occur within 500ms of user input. It looks at how much visible content shifted in the viewport as well as the distance the elements impacted were shifted.
You can perform the following optimizations to improve the Cumulative Layout Shift score from your core web vitals:
1. Use font:display values with your custom fonts
All those fancy google fonts might be causing FOIT and FOUT and the chances are you wouldn’t have thought it could lead to any problem.
If you are wondering, what’s FOIT and FOUT, allow me to explain.
When a browser needs a font from a web server, any element that uses that font will be hidden until the font asset has been downloaded fully. This is known as FOIT or flash of invisible text.
Similarly, browsers display a fallback font in the font stack until the custom one loads. This creates a flash of unstyled text or commonly known as FOUT.
Lighthouse can be your friend here in identifying what exactly is the cause of CLS. If the fonts are culprit, there are some easy fixes to deal with them. You can simply use font:display values
You can minimize these effects by using font:display values like auto, swap, block, fallback, and optional.
But if you want to be 100% sure there is no layout shift happening, you should use font:display in conjunction with .
2. Include width and height attributes on image and video elements
Specifying height and width on images used to be a healthy old practice, but with the popularity of responsive web design, it got lost. This is how it should be:
<img src=”datadab-home-page.jpg” width=”1440″ height=”810″ alt=”DataDab Home Hero Image”>
Modern web browsers now set the default aspect ratio of images based on the height width attributes of an image. So it’s a good practice to set them to prevent layout shifts.
img { aspect-ratio: attr(width) / attr(height);}
This predicts an aspect ratio, on the basis of dimension attributes before loading the image. It provides that information at the very beginning of the calculation of the layout. The aspect ratio is used to measure the height as soon as an image is told to be a certain width.
When dealing with responsive images, srcset determines the photos that you let the browser choose between what sizes each image is. To set attributes of img width and height, each image should use the same aspect ratio.
<img width=”1000″ height=”1000″ src=”dd-about-1000.jpg” srcset=”dd-about-1000.jpg 1000w, dd-about-2000.jpg 2000w, dd-about-3000.jpg 3000w” alt=”dd-about”/>
3. Set dimensions on ads and embeds
Ads are among the biggest contributors to layout shifts. Publishers and ad networks often support dynamic ad sizes. Owing to higher click rates and more advertisements competing in the auction, ad sizes improve efficiency and hence revenue. Sadly, due to ads pushing visible content that you are viewing down the page, this can lead to suboptimal user experience.
You can try these steps to reduce the chances of high CLS because of ads:
- Reserve space statically for ad slot. That is to say, style the item before loading the ad tag library.
- When putting ads in the content flow, make sure the slot size is allocated to avoid shifts. If loaded off-screen, those ads will not trigger layout shifts.
- When putting non-sticky ads near the top of the viewport, take extra care.
- Avoid collapsing the allocated space if a placeholder shows no ad when the ad slot is available.
- Eliminate layout shifts by reserving the ad slot with the widest possible duration.
- Use historical data to choose the most likely size for the ad slot.
4. Improve HTTP response and elements synchronization
Slow server HTTP response may also cause issues with the content layout. When you are using a CDN, loading of the indented elements takes quite a few milliseconds. That causes the content to jump. You then need to either build a space in DOM or synchronize the load with other elements.
5. Properly handle dynamically injected content
Never inject content above existing content, except for user interaction. This ensures anticipation of any layout shifts that occur.
You must have noticed layout shifts due to a UI that pops up at the top or bottom of the page when you’re trying to load a site. Just like an ad, this also happens with banners and forms that change much of the page‘s layout.
When you choose to display these kinds of UI elements, reserve enough space in the viewport for it in advance. Try to use a placeholder or skeleton UI so that once it loads, it does not trigger page content to move around unexpectedly.
Summary
Sometime in 2024, Google will update their algorithms to incorporate a new ranking factor: page experience. To measure page experience, Google developed a new set of metrics called the Web Vitals. Within these Web Vitals, you can find three core metrics: Largest Contentful Paint, First Input Delay, and Cumulative Layout Shift. These stand for performance, responsiveness, and visual stability — the three pillars of Google’s page experience update.
Now is the time to start working on improving core web vitals of your website because soon, these will become important ranking factors in Google search.
Let us know if you have any questions related to optimizing and improving core web vitals, in the comments below. We’d love to help you out!
Want to know more about improving your website’s core web vitals? Get in touch with us today and we’d be glad to help you out!
